Introduction
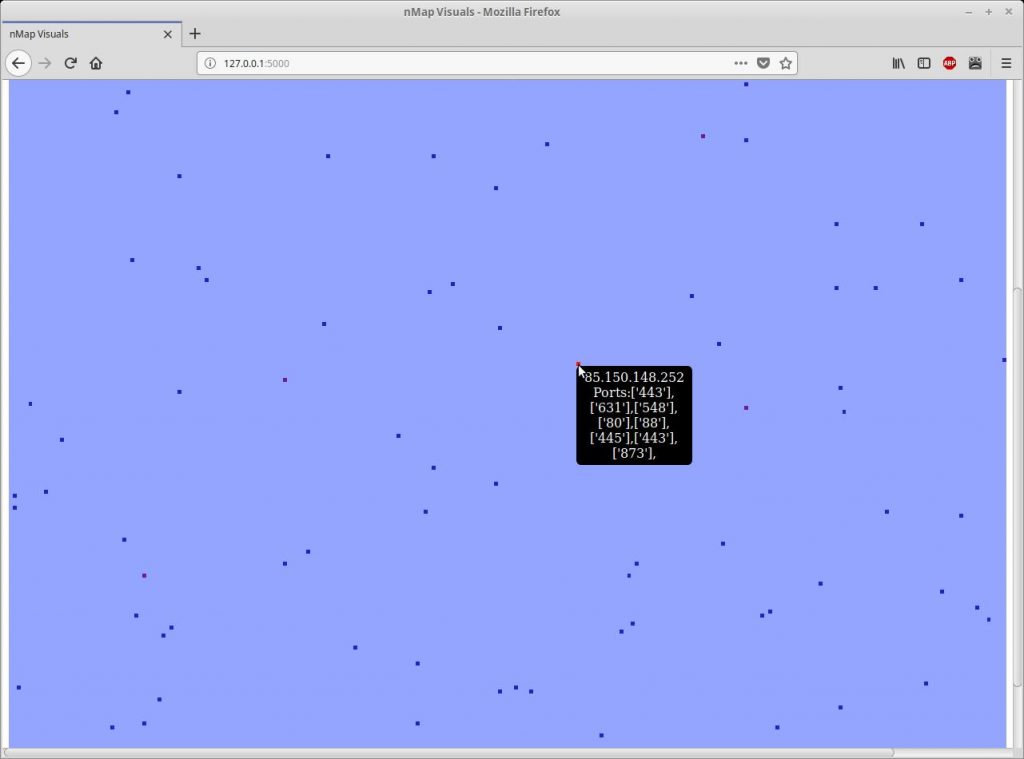
I have written a quick and dirty python script to visualise results from nMap and masscan. It works by parsing the XML log from a scan and generates a visual representation of the IP range that was scanned. The following screenshot is an example of the output:
 For lack of a better word I will refer to the output as the map from here on out. Each host is represented by a coloured square. The light blue squares which cover most of the map indicate that a host is offline (or just didn’t respond to the SYN from masscan.) The other coloured squares represent hosts which are online and have open ports. The colours of the squares range from blue to red. The more red the square is the more ports are open on the host. By hovering over each square the IP address and open ports will be shown in a tooltip.
The tool can be quite useful as it allows you to get a general overview of an IP range rather than trawling through log files. It allows you to easily see blocks of hosts within a scan. The tool can be downloaded at github I will however describe how the code works below.
How it works
Let me preface this by saying that this code is in no way optimised. I have run the code against the log of a /21 and it took around 40 seconds to generate the output map.
The first step is to find the range of IP addresses the scan was running on. This turned out to be a real pain as the scan command is not saved in the log file. Therefore we have to calculate the range based on the lowest and highest IP result. We parse the XML file from the scan and append each IP address scanned into a list called ipList
1
2
3
4
5
ipList = []
for event, element in etree.iterparse('output.xml', tag="host"):
    for child in element:
        if child.tag == 'address':
        ipList.append(child.attrib['addr'])
We then iterate through the ipList and split each octet into separate lists called firstOctetRange, secondOctetRange, thirdOctetRang and forthOctetRange.
1
2
3
4
5
6
7
8
9
10
11
12
13
14
firstOctetRange = []
secondOctetRange = []
thirdOctetRange = []
forthOctetRange = []
bitDelimeter = 0
startingIP = 0
endingIP = 0
for ip in ipList:
    binaryOctet = ''
    octets = ip.split('.')
    firstOctetRange.append(int(octets[0]))
    secondOctetRange.append(int(octets[1]))
    thirdOctetRange.append(int(octets[2]))
    forthOctetRange.append(int(octets[3]))
We then compare each octet of each result against the same octet of another result to determine the octet where the value changes. For example. If the first two octets are always the same. We know the CIDR notation of the scan would be greater than /16. I have used the variable bitDelimeter to store the value of the octet which the CIDR notation intercepts.
1
2
3
4
5
6
7
8
if min(firstOctetRange) != max(firstOctetRange):
    bitDelimeter = 0
elif min(secondOctetRange) != max(secondOctetRange):
    bitDelimeter = 1
elif min(thirdOctetRange) != max(thirdOctetRange):
    bitDelimeter = 2
elif min(forthOctetRange) != max(forthOctetRange):
    bitDelimeter = 3
The range of ip addresses scanned is the added to an ordered dict called parsedServers. The ip addresses are generated using a series of 4 nested FOR loops each one looping within the range 0 – 256. The octet where this range starts depends on the bitDelimeter. For example. If the IP address range 192.168.10.0/24 was scanned. The bit delimiter would be 3 indicating the last octet is the octet which changes its values. Therefore the loop to generate the IP addresses to put into parsedServers would have the first 3 octets fixed and loop through the range 0 – 256 for only the last octet. If we scanned a /21 the bit delimiter would be 2 and therefore the loop to generate the IP addresses would have the first first 2 octets fixed. The third octet would be generated from the range of the minimum third octet value from the scans and the maximum third octet values from the scans. The 4th octet would be through the range 0 – 256.
1
2
3
4
5
6
7
8
9
10
11
12
13
14
15
16
17
18
19
20
21
22
23
24
25
26
27
28
if bitDelimeter == 0:
    for one in range(min(firstOctetRange), max(firstOctetRange) + 1):
        for two in range(0, 256):
            for three in range(0, 256):
                for four in range(0, 256):
                    ip = "%d.%d.%d.%d" % (one, two, three, four)
                    parsedServers[ip] = []
if bitDelimeter == 1:
    one = min(firstOctetRange)
    for two in range(min(secondOctetRange), max(secondOctetRange) + 1):
        for three in range(0, 256):
            for four in range(0, 256):
                ip = "%d.%d.%d.%d" % (one, two, three, four)
                parsedServers[ip] = []
if bitDelimeter == 2:
    one = min(firstOctetRange)
    two = min(secondOctetRange)
    for three in range(min(thirdOctetRange), max(thirdOctetRange) + 1):
        for four in range(0, 256):
            ip = "%d.%d.%d.%d" % (one, two, three, four)
            parsedServers[ip] = []
if bitDelimeter == 3:
    one = min(firstOctetRange)
    two = min(secondOctetRange)
    three = min(thirdOctetRange)
    for four in range(min(forthOctetRange), max(forthOctetRange) + 1):
        ip = "%d.%d.%d.%d" % (one, two, three, four)
        parsedServers[ip] = []
We now have a parsedServer ordered dict that contains all IP addresses within the range we scanned. The next step is to add the open ports found in the scan to the parsedServer dict.
1
2
3
4
5
6
7
8
for event, element in etree.iterparse('output.xml', tag="host"):
    for child in element:
        if child.tag == 'address':
            ipAddress = child.attrib['addr']
        if child.tag == 'ports':
            for subChild in child:
                port = [subChild.attrib['portid']]
                parsedServers[ipAddress].append(port)
Now we need to generate a HTML page that we can use to visualise the results. This is done using Flask. We iterate through the pasedServers dict which contains all our data. An infoString is created and contains the IP address and ports of the current iteration. This is used in the tooltip when the cursor is hovered over a square on the map. A htmlBuffer is created and append to on each iteration of the parsedServers dict. Each iteration adds the HTML code to add a new table data cell with the colour pulled from the colourRange list. The square root of the total addresses in the range indicates when a new row will be needed in the table. This allows the results to be square on the page.
1
2
3
4
5
6
7
8
9
10
11
count = 0
htmlBuffer = Markup('')
for key, value in parsedServers.items():
    infoString = str(key) + '<br>'
    if value:
        infoString += 'Ports:'
        for portValue in value:
            infoString += str(portValue) + ','
    colourRange = ['94A5FF', '0024E5', '2422C5', '4821A6', '6D1F87', '911E67', 'B61C48', 'DA1B29', 'FF1A0A']
    htmlBuffer += Markup('<td class="tooltip", bgcolor="' + colourRange[len(value)] + '"><span class="tooltiptext">' + infoString + '</span></td>')<br>    count += 1<br>    if count > math.sqrt(len(parsedServers)):<br>        htmlBuffer += Markup('</tr><tr>')
        count = 0
For example. We are on an iteration in parsedServers with the address 192.168.10.22 with 3 ports open. A table data cell will be created with the IP address and ports listed in the tooltip. The background colour of the cell will be pulled from the colourRange list which contains 9 hexadecimal colour codes. The higher the index on the list, the more red the colour is. With this example the IP address has 3 ports open. So the colour in the 3rd index will set to the background colour making the data cell purple.
We finally render the template the pass to it the htmlBuffer. The web server is then run. The output can be found by browsing to 127.0.0.1:5000.
1
2
3
4
5
6
@app.route('/')
def index():
    return render_template('index.html', name=htmlBuffer)

if __name__ == '__main__':
    app.run()
Please feel free to email me if you have any questions regarding the code.